


Use empathetic leadership to jumpstart team performance
How many leaders could you describe as empathetic? If you’re a leader, do you see yourself as empathetic?
Read More
Unlock the full potential of Power BI in 2025 with this comprehensive guide for professionals. Learn business intelligence strategies, dashboard tips, and career insights to stay ahead in data analytics.

In the data-centric landscape of 2025, the ability to translate raw data into strategic assets is not merely an advantage—it is a business imperative. Across every global industry, from finance to manufacturing, the demand for professionals skilled in data analysis and visualization has reached an all-time high. For students entering a competitive job market and professionals seeking career acceleration, proficiency in a leading business intelligence (BI) platform is non-negotiable.
This guide focuses on Microsoft Power BI, a tool that consistently dominates the BI space. Year after year, Gartner's Magic Quadrant for Analytics and BI Platforms places Microsoft as a leader, a testament to its comprehensive vision and robust capabilities. Mastering this platform is a strategic investment in a skill set that is foundational for high-impact roles in data analytics, business consulting, and beyond.
👉 Join Skillected’s Power BI With AI Course Today
Microsoft Power BI is an integrated suite of services, applications, and data connectors designed for enterprise-level data analysis. It empowers organizations to connect to disparate data sources, model this data into a cohesive whole, and generate immersive, actionable insights. As a cornerstone of the Microsoft ecosystem, it offers seamless integration with Azure, Microsoft 365, and the new unified analytics platform, Microsoft Fabric.
Developing expertise in Power BI requires a multi-faceted skill set. The following competencies represent the critical path from novice user to professional developer.
To distinguish yourself in the job market, you must move beyond the fundamentals.
The BI landscape is evolving rapidly, driven by AI and unified data platforms.
The application of Power BI is vast and transformative across various sectors including Finance, Healthcare, Retail, and Manufacturing, where it is used for everything from financial performance analysis and patient outcome tracking to inventory optimization and predictive maintenance.
The demand for Power BI skills translates directly into lucrative career opportunities.
Learning Power BI in 2025 is more than acquiring a software skill; it is about positioning yourself at the forefront of the data economy. Begin by downloading Power BI Desktop and tackling a personal project. As you progress, focus on building a strong foundation in data modeling and DAX, as these are the skills that truly differentiate a professional from an amateur. For those ready to commit to a career in business intelligence, pursuing structured, advanced training is the logical next step. Explore the career-focused curriculum at Skillected to transform your ambition into certified expertise. The future of business is driven by data; with Power BI, you can be the one in the driver's seat.
👉 Join Now – Power BI with AI (6-Day Live Course)

How many leaders could you describe as empathetic? If you’re a leader, do you see yourself as empathetic?
Read MoreWe’re more connected technologically than we’ve ever been. Yet the need for collaboration grows.
Read MoreLeaders must work to get ahead of gossip and misinformation, especially during times of change.
Read MoreHow many leaders could you describe as empathetic? If you’re a leader, do you see yourself as empathetic?
Read MoreWe’re more connected technologically than we’ve ever been. Yet the need for collaboration grows.
Read MoreLeaders must work to get ahead of gossip and misinformation, especially during times of change.
Read More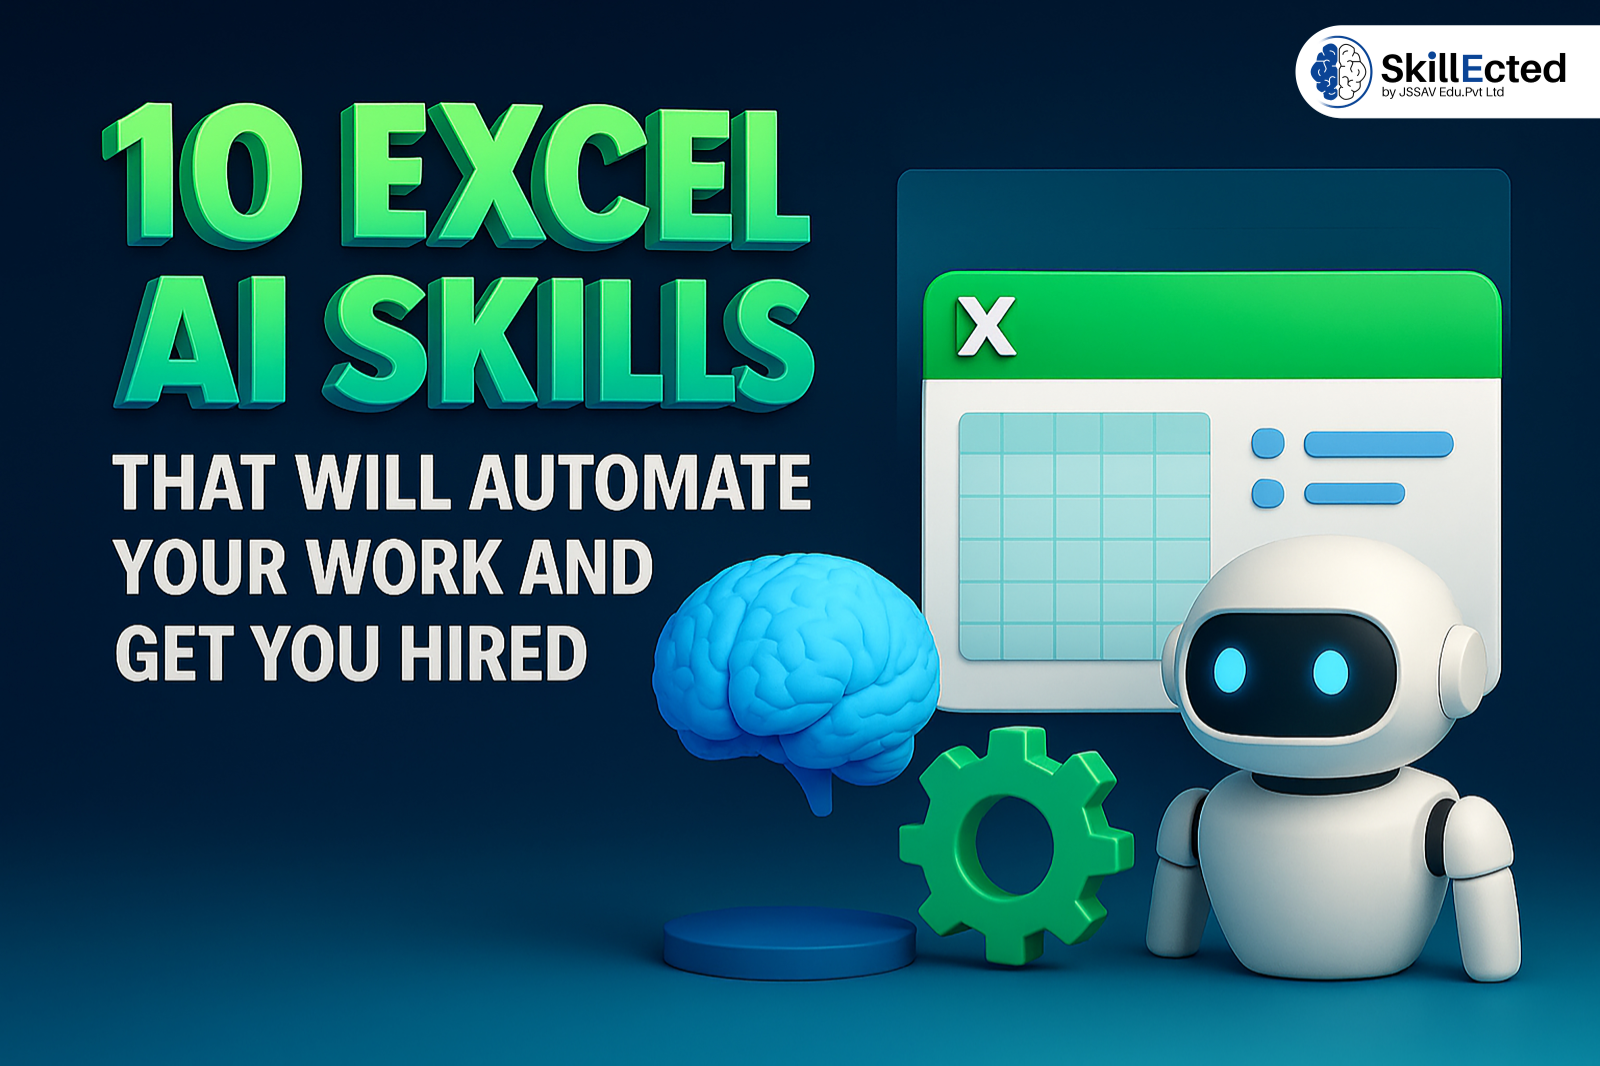
10 Excel AI Skills That Will Automate Your Work and Get You Hired – A Guide by Skillected...
Read More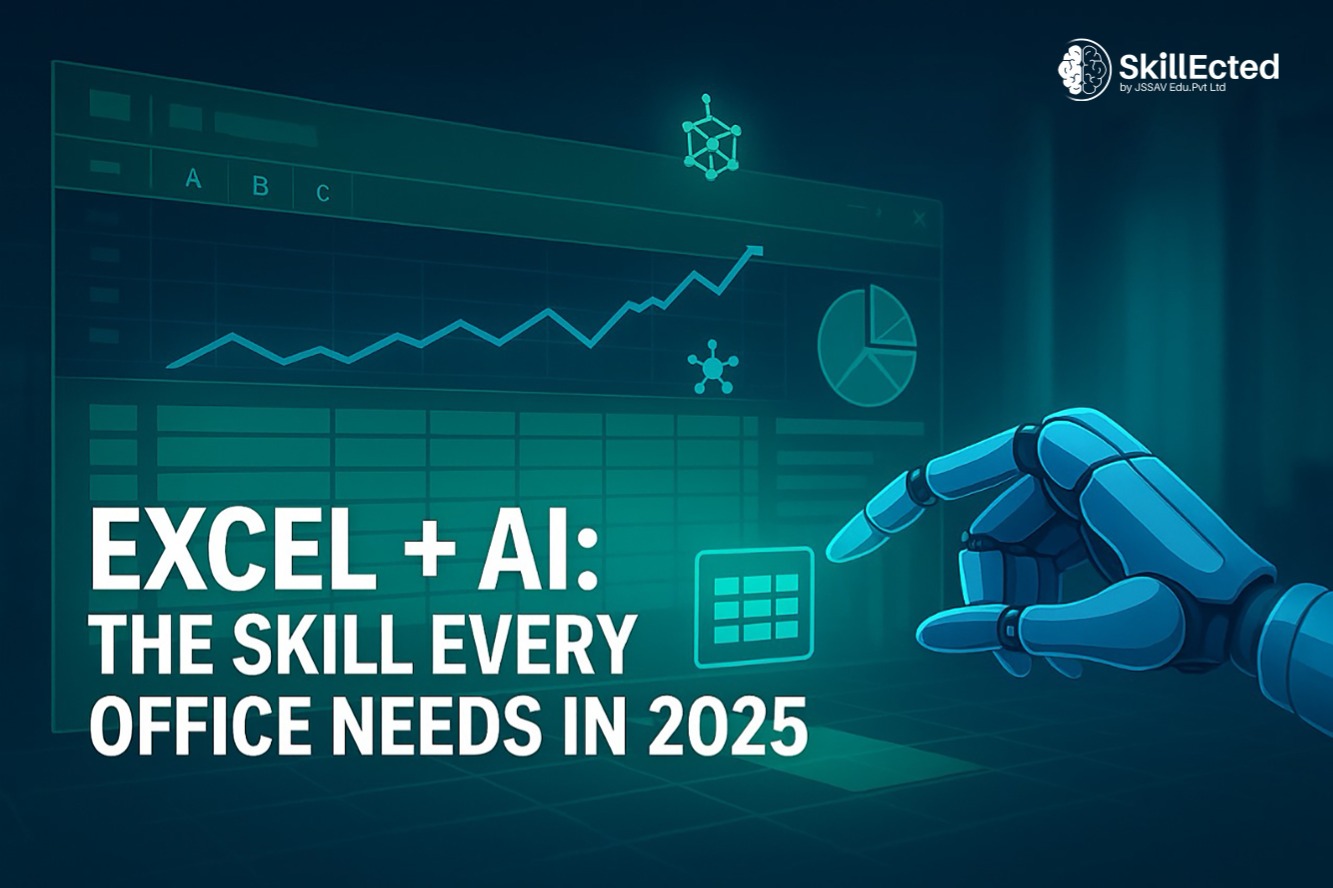
Excel AI skills are essential for modern professionals. Don’t just learn Excel — learn how to work smarter with AI.
Read MoreOnly 10% of 15 lakh engineering graduates likely to land jobs this year. Here’s what that means.
Read MoreOnly 10% of 15 lakh engineering graduates likely to land jobs this year. Here’s what that means.
Read More